Financial performance (Standalone)
Delivering
sustainable returns
Our performance during the year was marked by strong growth in cement volumes as well as higher price realisations. Despite a steep increase in fuel costs, our cost-efficiency measures under project ‘Parvat’ enabled us to deliver robust performance.
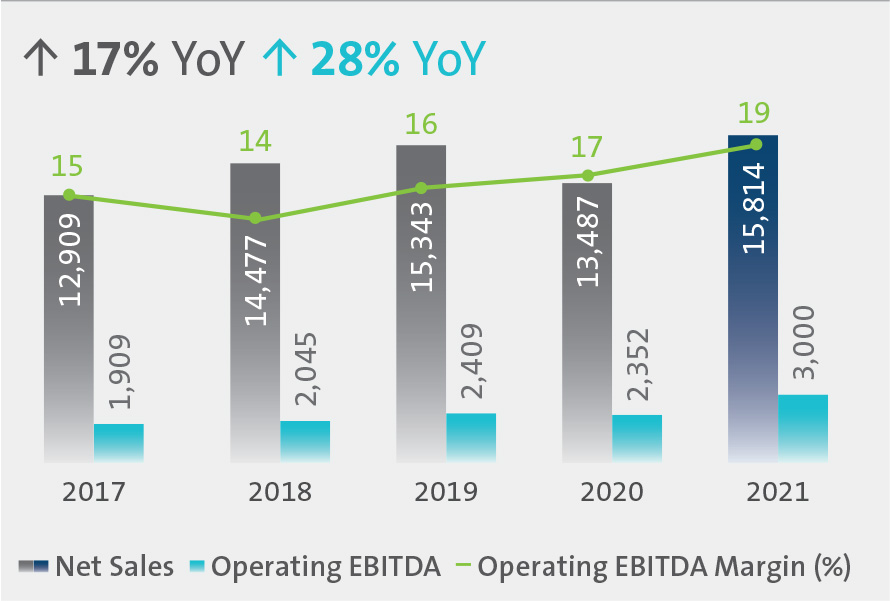
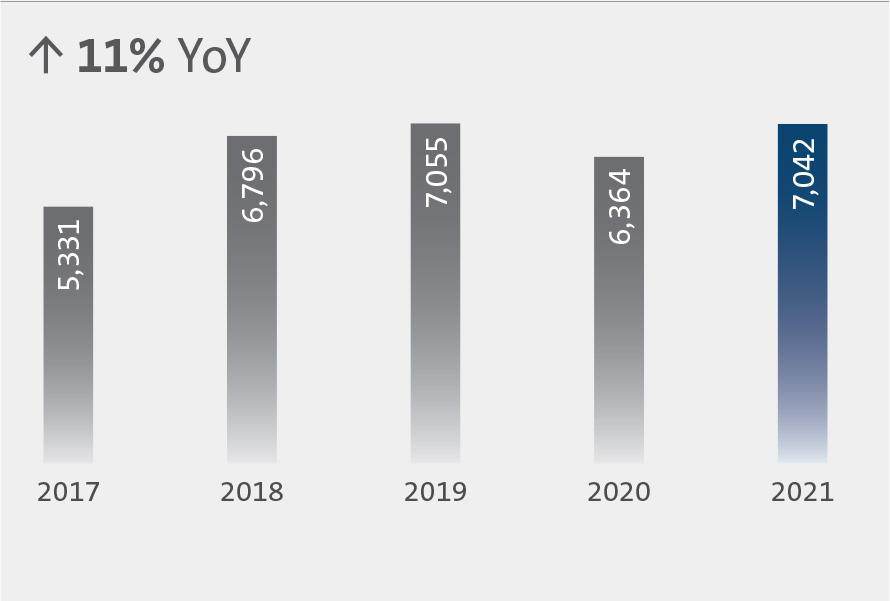
Net Sales, Operating EBITDA &
Operating EBITDA Margin (` Crore)
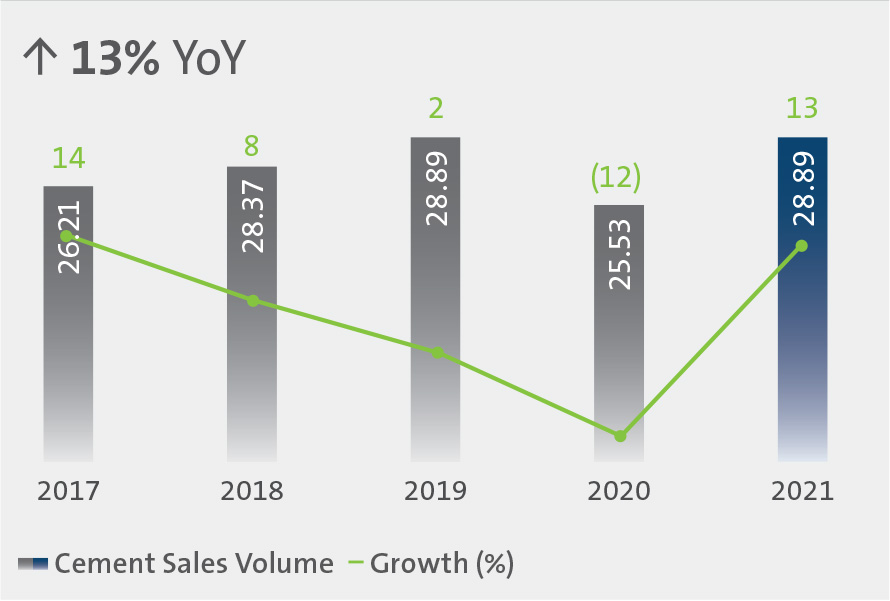
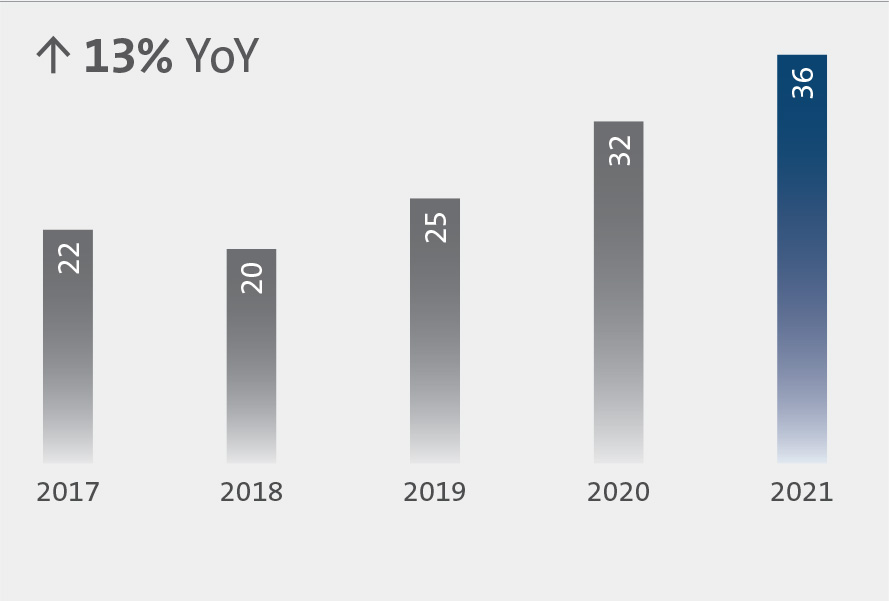
Cement Sales Volume &
Growth (MT)
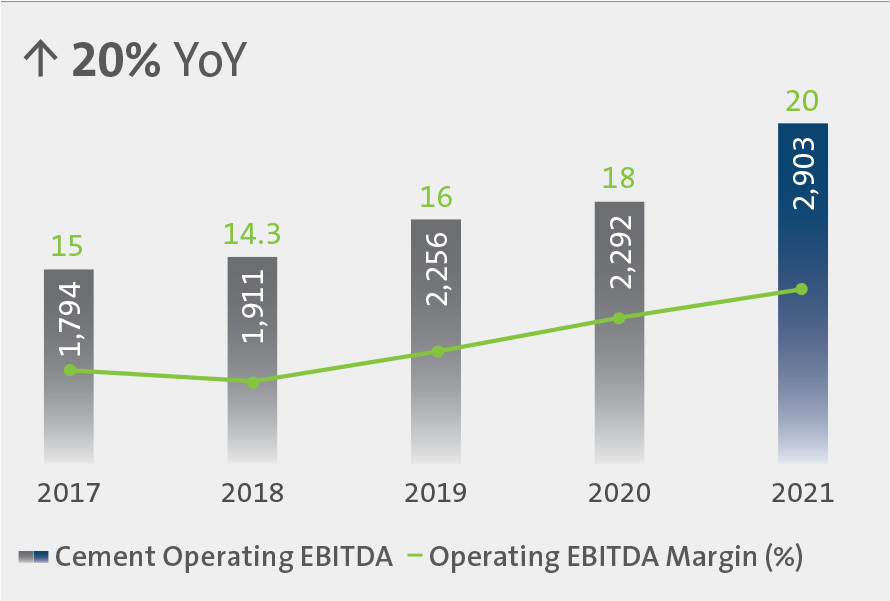
Cement Operating EBITDA &
Operating EBITDA Margin (` Crore)
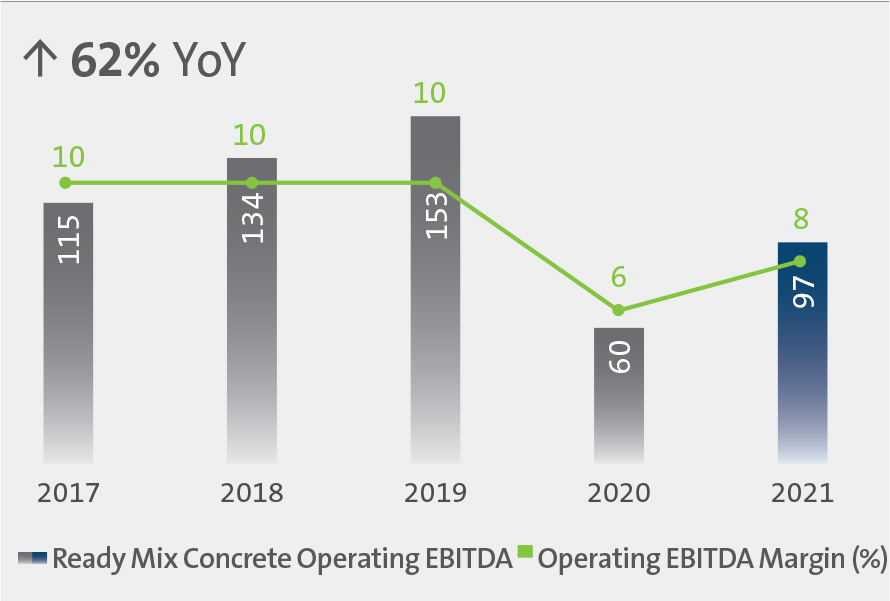
Ready Mix Concrete Operating EBITDA &
Operating EBITDA Margin (` Crore)
Profit Before Tax (PBT) &
Profit After Tax (PAT) (` Crore)
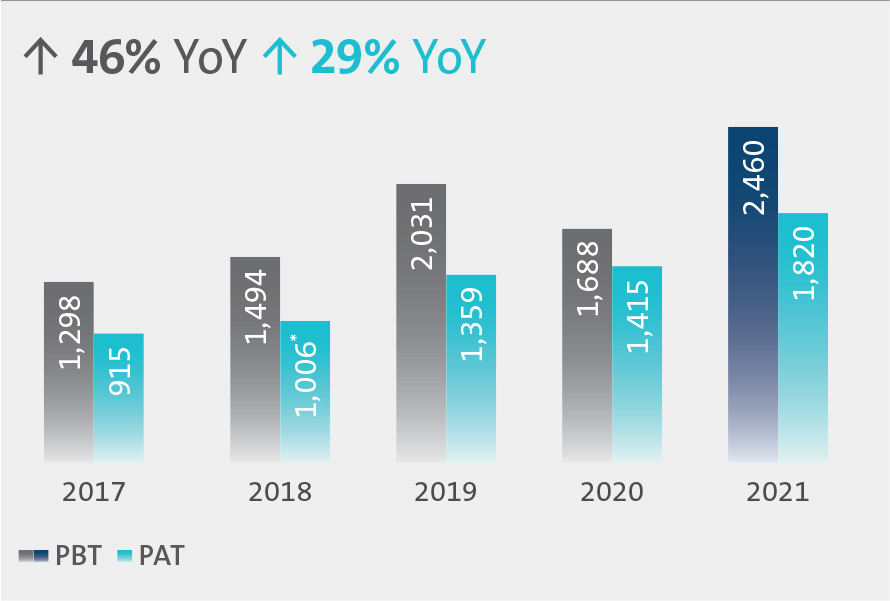
*Excludes write-back of `501 Crore related to tax provision
Dividend Per Share, Earnings Per
Share and Dividend Payout Ratio (` per share)
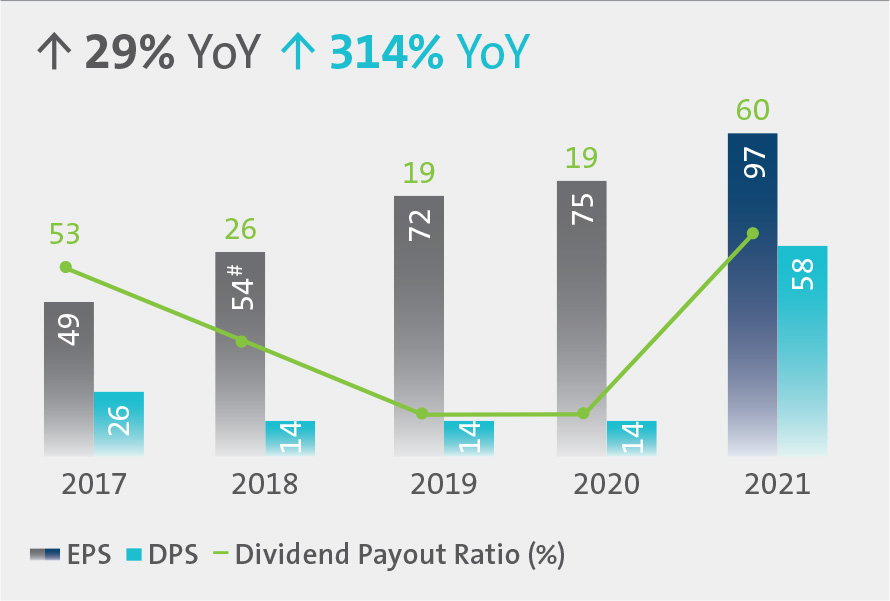
# EPS is calculated excluding write-back of tax provision
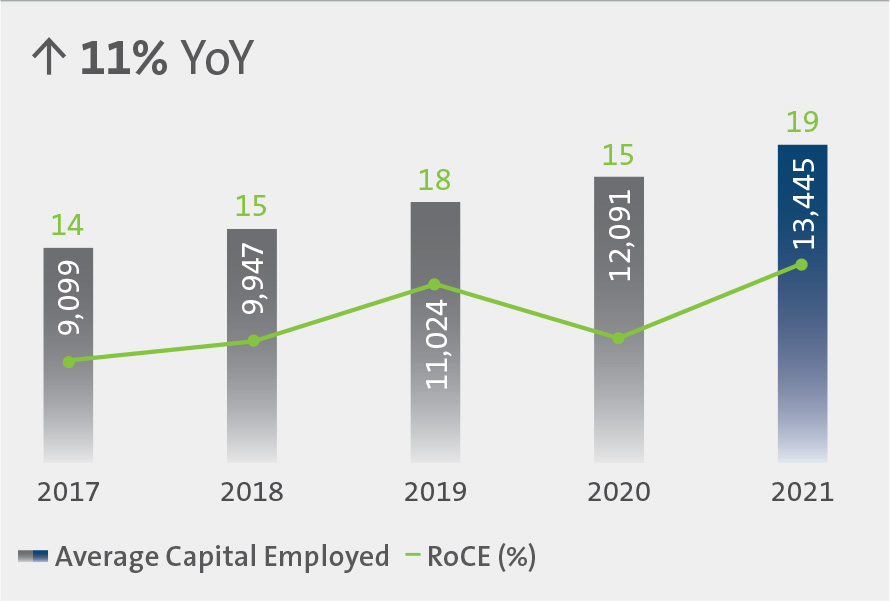
Average Capital Employed &
Return on Capital Employed (RoCE) (` Crore)
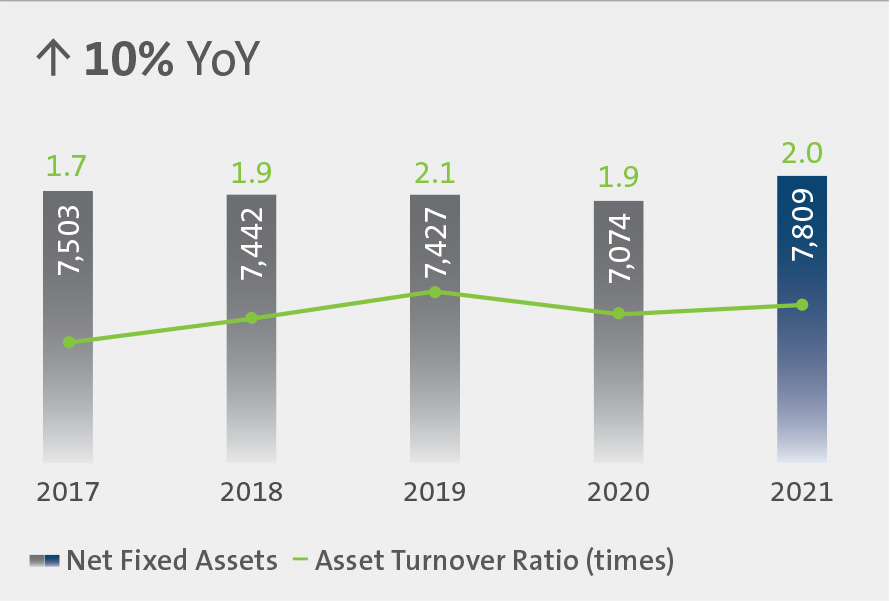
Net Fixed Assets &
Asset Turnover Ratio (` Crore)
Book Value Per Share
(` per share)
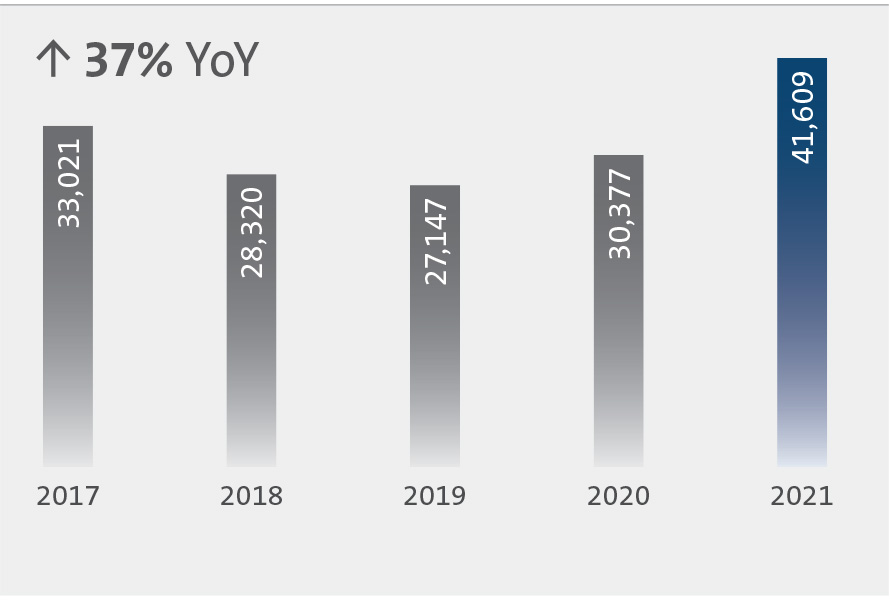
Market Capitalisation
(` Crore)
Contribution to
Exchequer (` Crore)
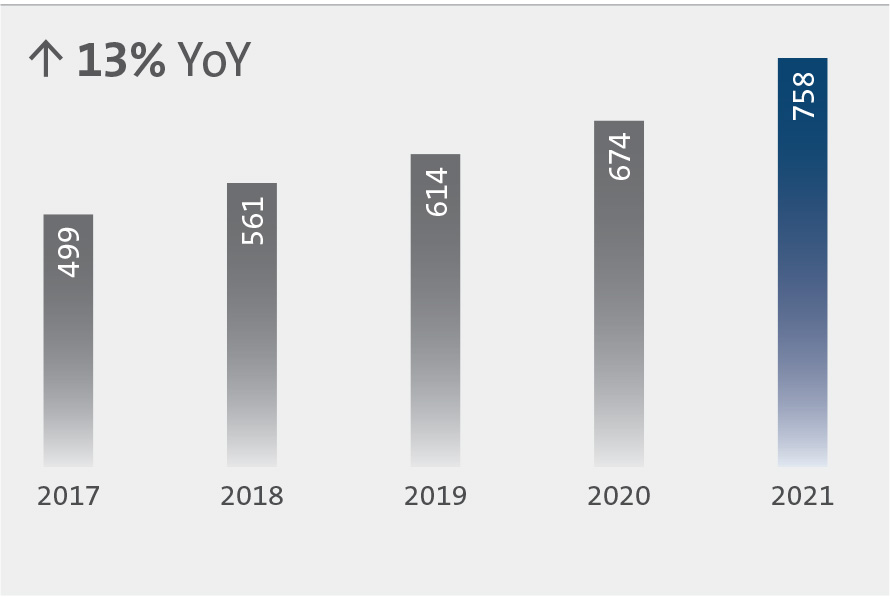
Corporate Social Responsibility
Expenditure
(` Crore)
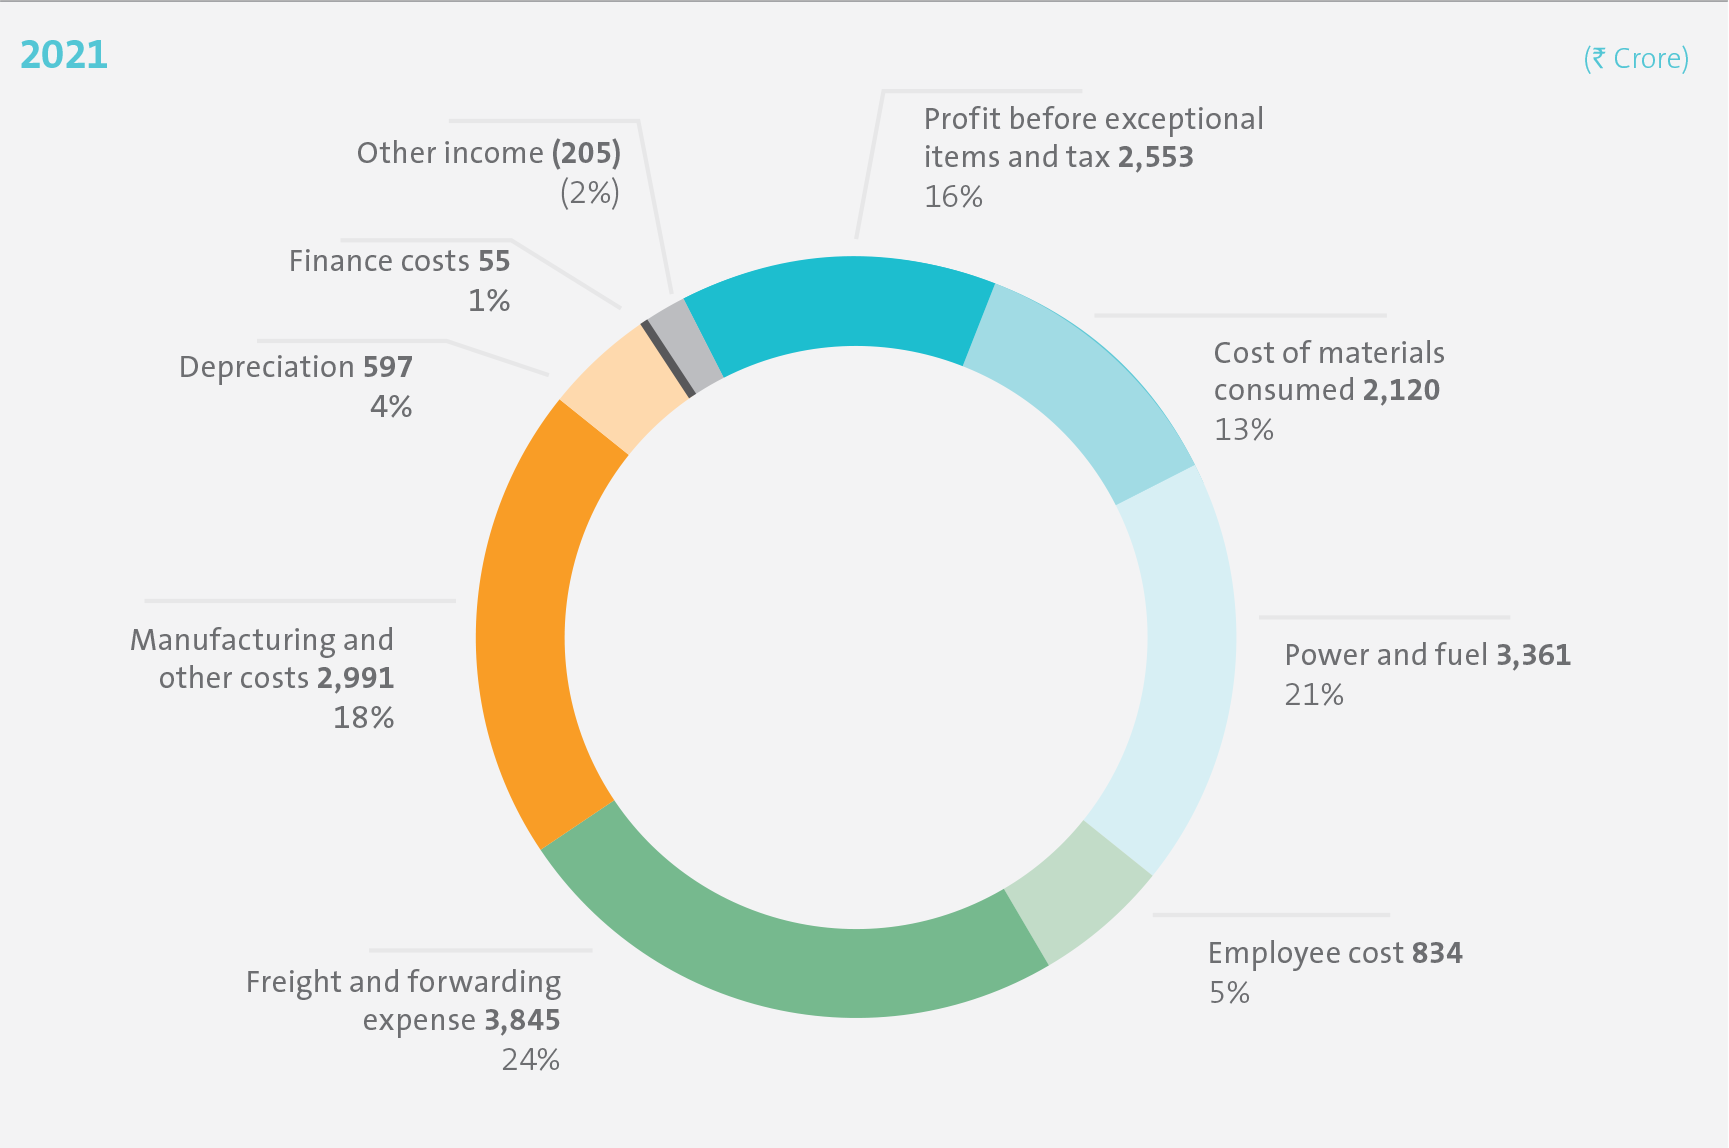
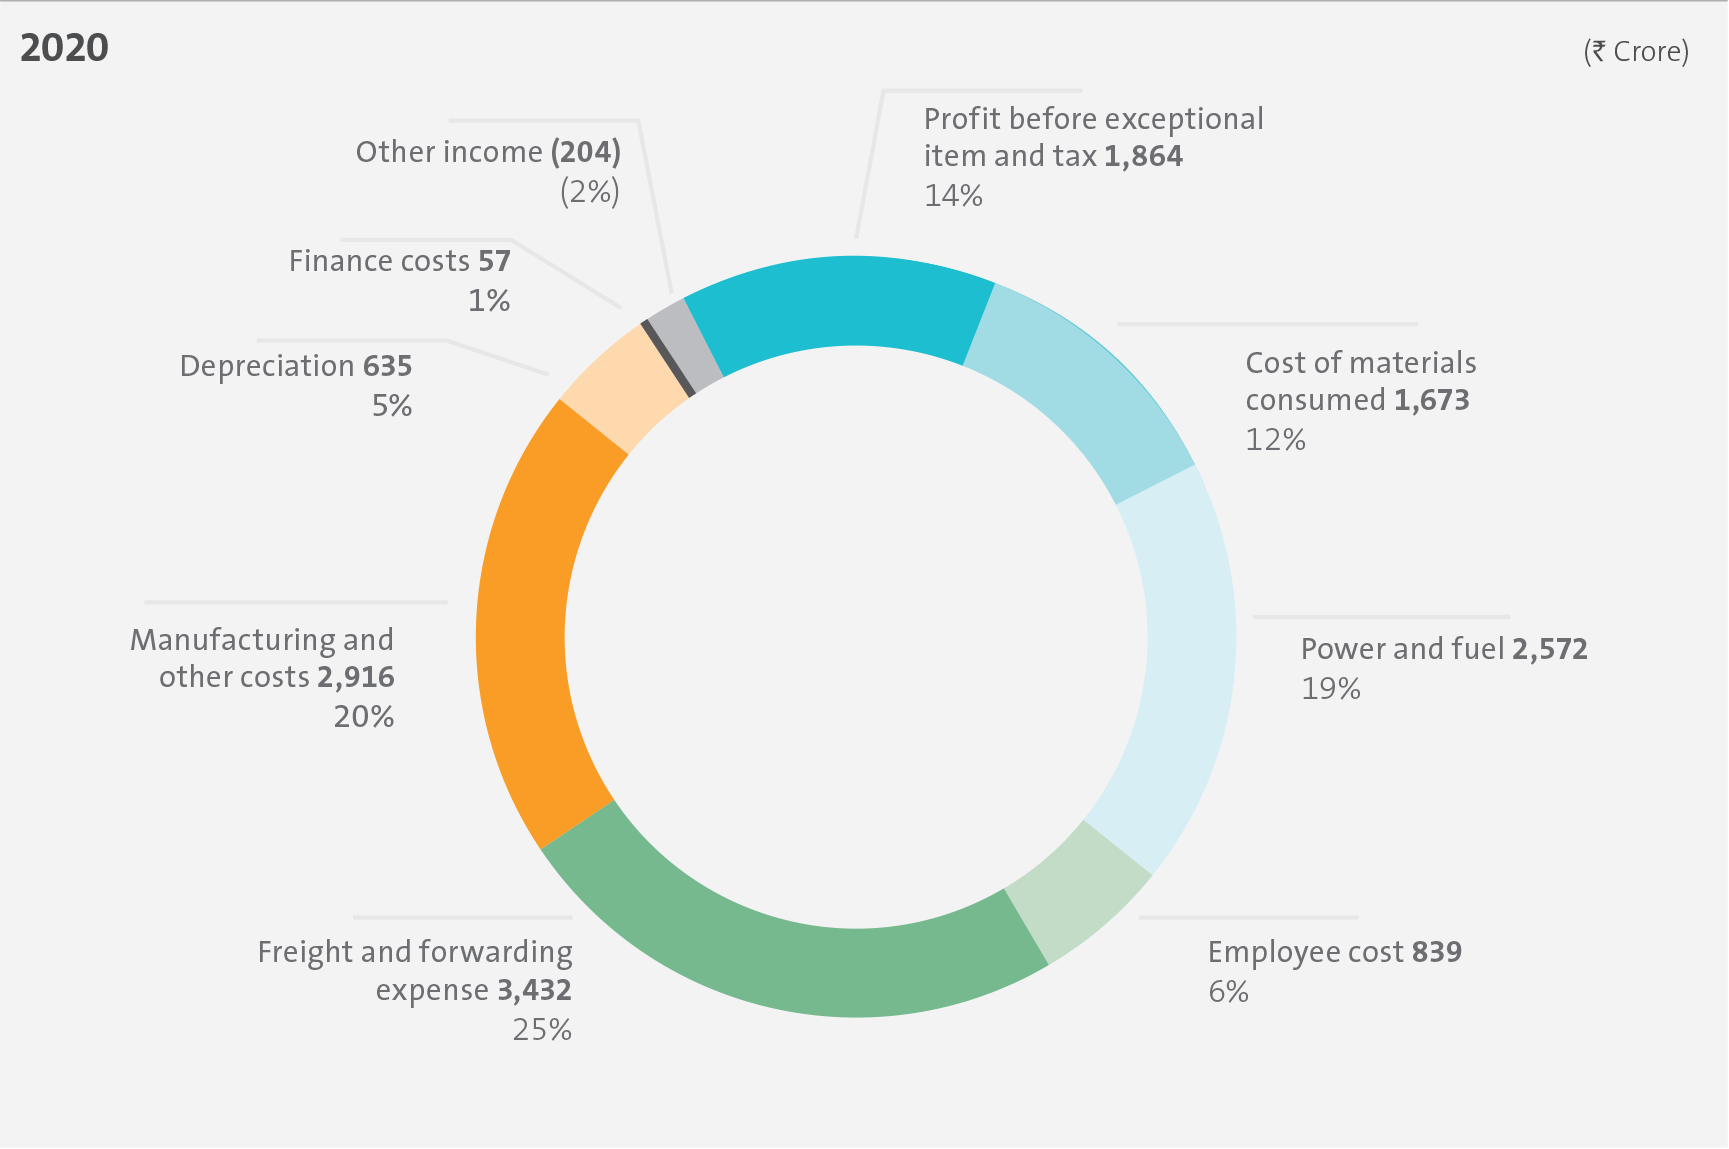
Cost and profit as a percentage of revenue from operations