Adjusted EBITDA
APL

Note: Includes prior period items contributing ` 9,322 cr to EBITDA
APSEZ
AESL
AEL
AGEL
ATGL
APL
Ambuja Cements Limited
(with subsidiaries ACC Limited and Sanghi Industries Limited)
AWL
PAT
APL
APSEZ
Comparable PAT*
AESL
AEL
AGEL
ATGL
APL
Ambuja Cements Limited
(with subsidiaries ACC Limited and Sanghi Industries Limited)
AWL
*Comparable PAT excludes all one-time items like regulatory income, provisions, bilateral charges
Note 1: Growth pertains to growth in FY 2023-24 vs FY 2022-23
Note 2: Adjusted EBITDA: PAT incl. Share of Profit from JV + Current Tax + Deferred Tax +
Depreciation + Finance Cost + Unrealised Forex Loss / (Gain) + Exceptional Items
Note 3: EBITDA and PAT of AWL was impacted on account of hedges dis-alignment, tariff rate quota
disparity and losses in Bangladesh operations
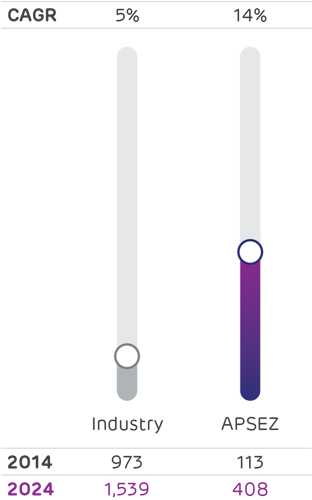
Cargo Volume
Growth (MMT)
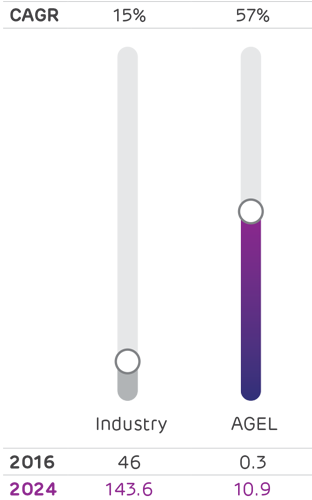
Renewable Capacity
Growth (GW)
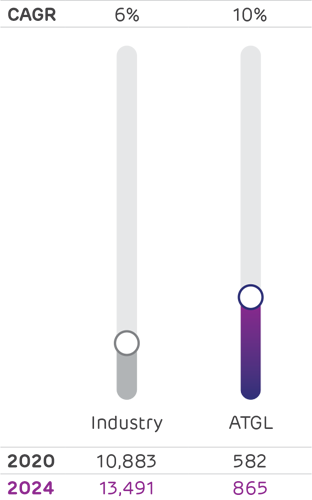
Transmission Network
Growth (ckm)
City Gas Distribution
Volume (MMSCM)
Passenger Traffic
(Mn)
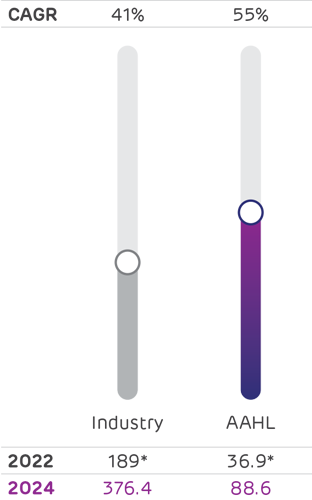
Note: The start year considered for industry data is the year when the business commenced.
* Pax numbers were impacted due to pandemic in FY 2021-22