Performance Highlights FY 2024-25
A Track Record of Growth
Financial Indicators
Revenues
from Operations
(` crore)
2020
2021
2022-23*
2023-24
2024-25
EBITDA
(` crore)
2020
2021
2022-23*
2023-24
2024-25
EBITDA
Margin
(%)
2020
2021
2022-23*
2023-24
2024-25
Book Value
Per Share
(` per share)
2020
2021
2022-23*
2023-24
2024-25
Profit
Before Tax
(` crore)
2020
2021
2022-23*
2023-24**
2024-25
Profit
After Tax
(` crore)
2020
2021
2022-23*
2023-24**
2024-25
Earnings Per
Share
(` per share)
2020
2021
2022-23*
2023-24
2024-25
Average Capital
Employed
(` crore)
2020
2021
2022-23*
2023-24**
2024-25
Operational Indicators
Cement
Sales Volume
(MnT)
2020
2021
2022-23*
2023-24
2024-25
Cement
Production Volume
(MMT)
2020
2021
2022-23*
2023-24
2024-25
*The Company had changed its financial year ending from December 31 to March 31.
FY 2022-23 was for 15 months (January 01, 2022 - March 31, 2023).
Therefore, the data for FY 2023-24 and FY 2024-25 is not comparable with the figures for the
15 months year ended March 31, 2023
**Restated, refer note 63 (D) of Consolidated
Financial Statement
Cost and Profit as a Percentage of Revenue from Operations
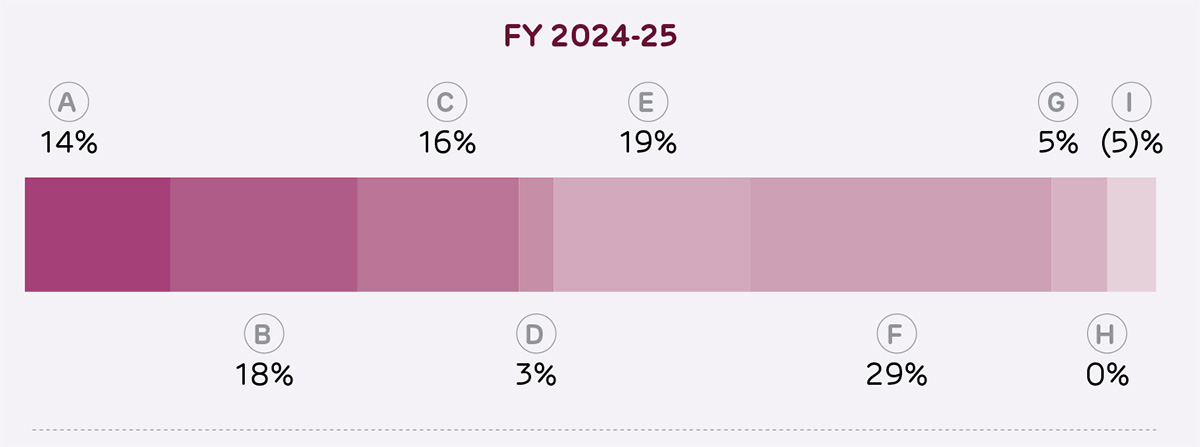
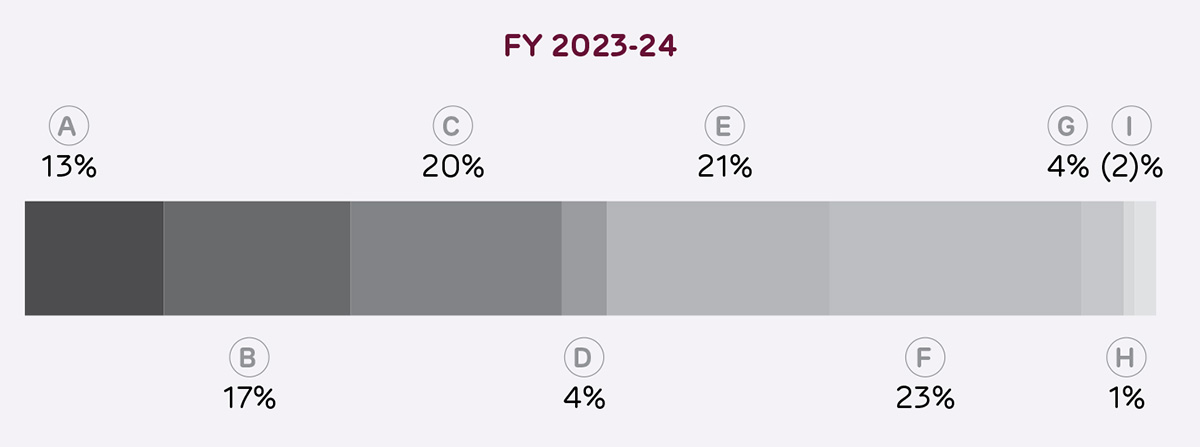
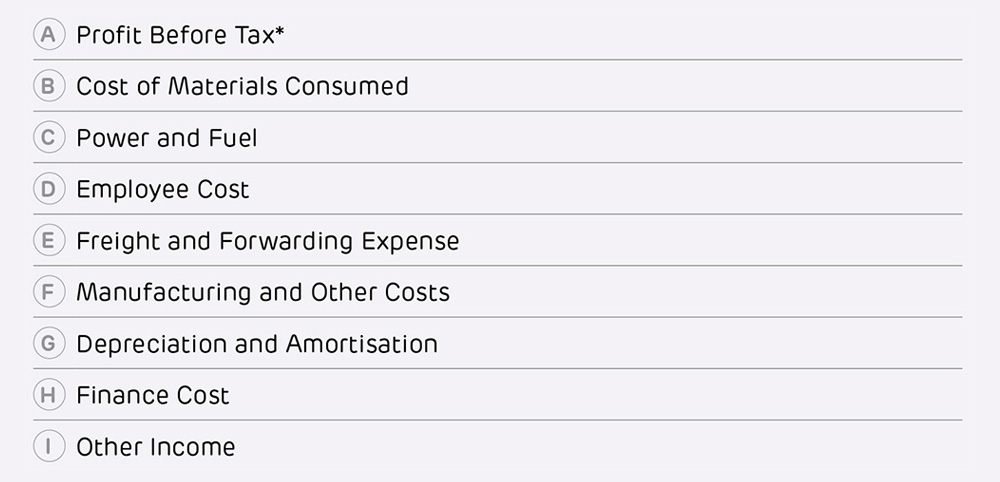
*Before exceptional items and before share of profit of associates and joint ventures