Performance
Delivering results
through
optimisation
DURING 2020, OUR CORE FOCUS WAS ON:
2020 OPERATIONAL HIGHLIGHTS

Parvat: Implemented several initiatives relating to efficiencies and input cost levers across the value chain. Cost savings on track from these initiatives

Ready mix concrete launched value added solutions: ACC Thermofillcrete, ACC Suraksha NX and ECOPact – the Green Concrete

Undertook capacity expansion through organic route to sustain and grow market share and capitalise on the growing demand for cement consumption in the eastern and central regions

Margin expansion driven by product mix optimisation and cost-efficiency initiatives

Generation of additional cash and cash equivalents driven mainly by strong working capital actions

Achieved specific carbon emissions of cementitious materials below 500 kg/t

Rolled out a new digital-first campaign for our innovative product – Gold Water Shield, a water-repellent cement

Initiated an AI-powered supply chain management platform ‘Blue Yonder’ to enable better predictability, prevent and resolve disruptions across business
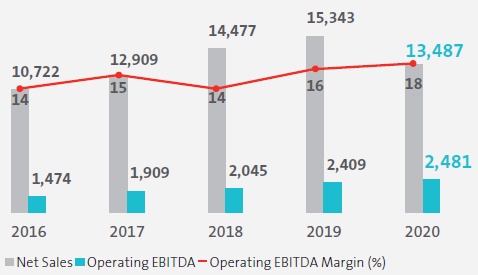
PERFORMANCE HIGHLIGHTS (STANDALONE FINANCIALS)
Net Sales, Operating EBITDA &
Operating EBITDA Margin* (` Crore)
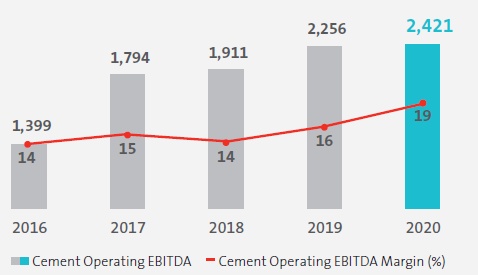
Cement Operating EBITDA &
Operating EBITDA Margin* (` Crore)
Profit Before Tax (PBT) &
Profit After Tax (PAT)# (` Crore)

# Excludes write-back of `501 Crore related to tax provision
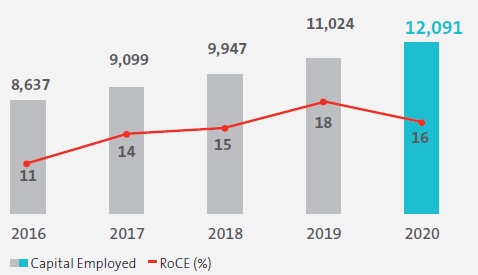
Average Capital Employed &
Return on Capital Employed (RoCE)* (` Crore)
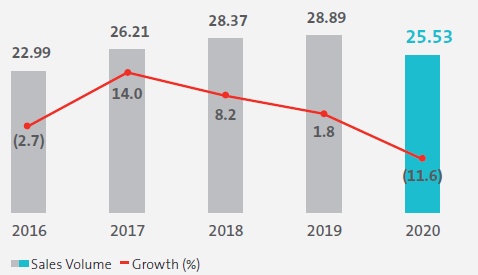
Cement Sales Volume &
Growth (MT)
*Excluding charge of `129 Crore towards time value of money of Government incentives in 2020
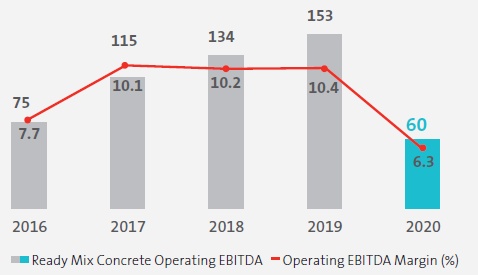
Ready Mix Concrete Operating
EBITDA & Operating EBITDA Margin (` Crore)
Dividend Per Share, Earnings Per
Share# and Dividend Payout Ratio** (` per share)
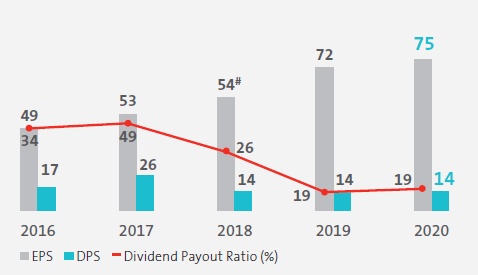
# EPS is calculated excluding write-back of tax provision
**Dividend payout ratio is calculated without considering
dividend distribution tax
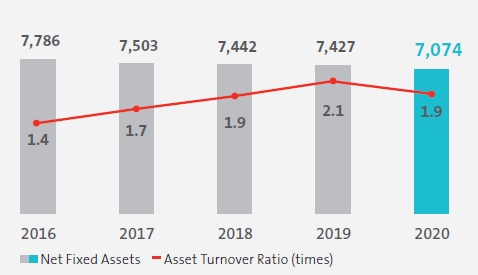
Net Fixed Assets &
Asset Turnover Ratio (` Crore)
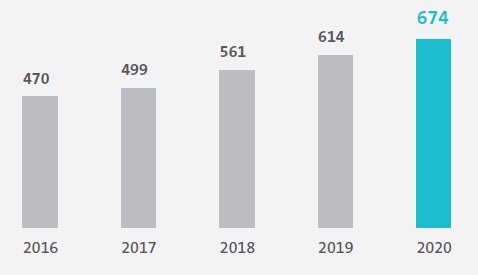
Book Value Per Share (` per share)
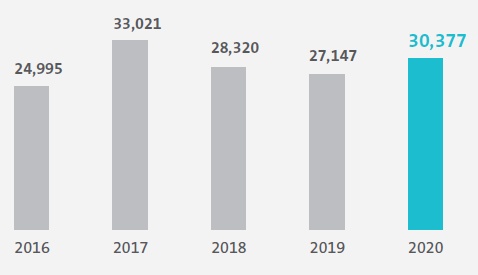
Market Capitalisation (` Crore)
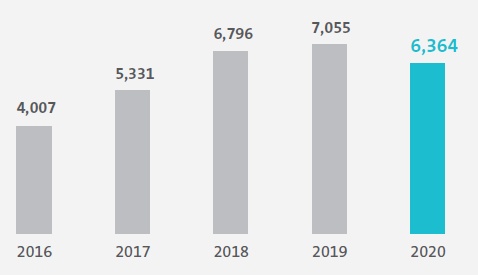
Contribution to Exchequer (` Crore)
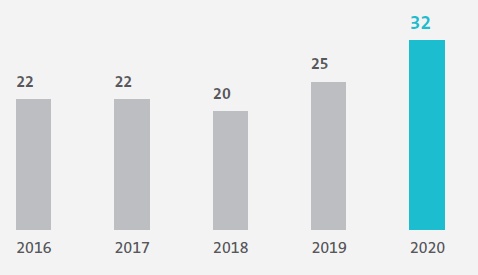
Corporate Social Responsibility
Expenditure (` Crore)
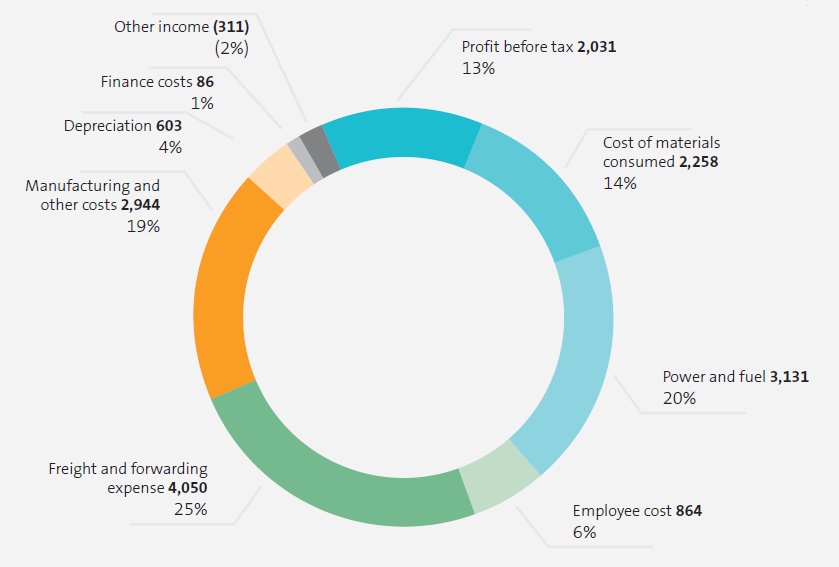
COST AND PROFIT AS A PERCENTAGE OF REVENUE FROM OPERATIONS
2020 (` Crore)

2019 (` Crore)